Context
Most research on what people listen to looks at the listener: age, personality, social setting. Far less looks at the environment. One study of UK listeners found that more upbeat, higher-intensity songs tracked warmer, drier days. We wanted to know whether the same pattern shows up in Spain.
We limited the analysis to a single country to keep culture and day length roughly constant. Spain suited that: streaming there is dense, and its climate is fairly uniform.
Problem
Spotify doesn't publish how listeners feel, only what ranks on the charts. So we measured mood indirectly, through the audio features of the charting songs: valence (how positive a track sounds), energy, and danceability.
The harder problem was everything else that moves the charts. Release days, holidays, viral hits, and changes at Spotify itself all shift those numbers, and any weather signal had to be found underneath them.
What we did
We built a Spain-by-day dataset from three public sources: Spotify's daily Top 200 charts for Spain, a database of audio features for tracks, and daily temperature readings for Madrid. Each needed cleaning before it could be joined. About 90,900 of the 449,259 chart rows had no stream count and were dropped. Extreme stream counts were trimmed using the interquartile range. Artist and song names were standardized, by lowercasing and stripping featured-artist credits and parentheses, so the same track could be matched across sources.
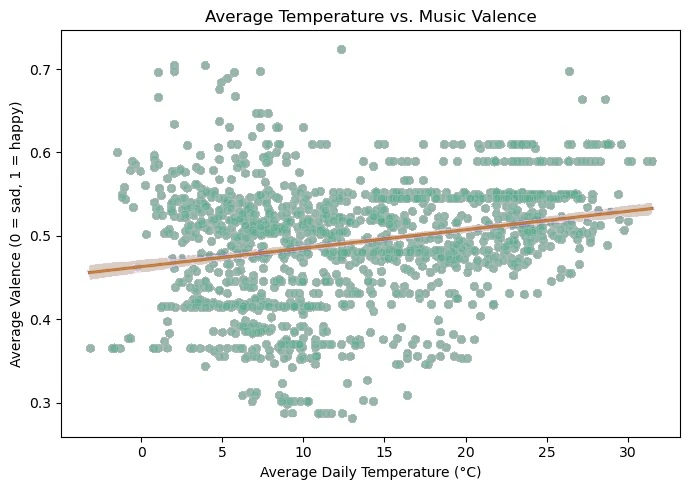
Before modeling anything, we explored the data: daily streams over time, genre mix by season, how energy and valence vary across seasons, and temperature against average valence across 1,424 days. Then we fit linear regressions and ordinary least squares models, including a composite mood index that averages valence, energy, and danceability.
Three public datasets, 1,424 days, and one question: how much of the mood of what Spain streams can the weather explain?
- 1,424Days analyzed
- 80,019Track-day rows modeled
- ≤0.2%Variation in mood explained by weather
Results · temperature and valence
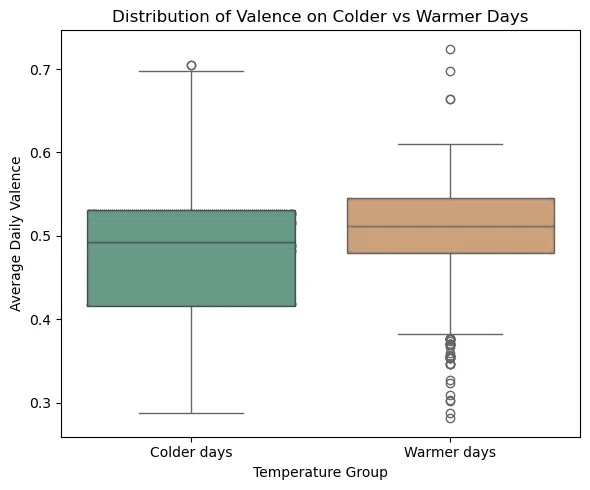
The first chart plots each day as a dot, with a fitted line. The second shows valence on colder and warmer days, split at the median temperature. Both show a small shift inside a much larger spread.
What we found
The relationship was real in the technical sense and negligible in practice. Across the daily data, the fitted line rises about 0.02 on a 0 to 1 valence scale for every 10 degrees Celsius of warming. Daily valence ranged from roughly 0.3 to 0.7, so the slope is small next to the spread. Splitting days into colder and warmer halves gave two distributions that overlap heavily.
The models said the same thing in numbers. Temperature explained about 0.1% of the variation in the mood index, and season explained about 0.2%. Both were statistically significant, because the sample was large, but the effects were small. The direction of the temperature effect even differed between the valence-only model and the composite mood index, and winter tracks scored slightly higher than summer ones, the opposite of what we had predicted.
Total daily streams also fell sharply during 2019, possibly because of a change in how Spotify reports its charts, which makes the streams result hard to interpret.
Finding
Weather explained at most 0.2% of the variation in musical mood. What Spain streams looks shaped far more by culture, labels, and the platform than by the forecast.
Limits
Mood here is an indirect measure. Audio features describe the songs on the chart, not the feelings of the people streaming them, and what reaches the chart depends on labels, playlists, and viral moments. The temperature data came from Madrid alone, which may not match the weather where most listeners were. Matching songs across datasets was imperfect, and some tracks matched under more than one genre. We also did not control for holidays or release days, even though the research we reviewed flagged both as likely confounders.
A stronger test would use listener-level logs and local weather, add explicit controls for holidays and release days, and check for non-linear effects on very hot or very cold days, which we hypothesized but did not test.
The full report and notebook are available on request.